Strong Stocks for week of 20-Apr-2026 to buy. Ticker: BE. Last 4 weeks high = 229.55. Last 4 weeks low = 116.50. Last week high = 170.88. Current close is = 207.86. inc by 59.28%. BE open:207.86, high :234.55, pass Ticker: CRDO. Last 4 weeks high = 168.97. Last 4 weeks low = 86.49. Last week high = 122.31. Current close is = 160.69. inc by 58.63%. CRDO open:160.65, high :184.46, pass Ticker: DAVE. Last 4 weeks high = 256.18. Last 4 weeks low = 164.00. Last week high = 186.39. Current close is = 250.71. inc by 52.07%. DAVE . open:247, high :284, pass Ticker: SITM. Last 4 weeks high = 505.00. Last 4 weeks low = 306.62. Last week high = 430.02. Current close is = 503.63. inc by 46.50%. SITM open:505, high :540, pass. Ticker: TVTX. Last 4 weeks high = 43.31. Last 4 weeks low = 26.48. Last week high = 33.78. Current close is = 40.77. inc by 44.11%. TVTX open:40.77, high :40.87, close:38.78 ,fail. Ticker: COHR. Last 4 weeks high = 345.12. Last 4 weeks low = 215.55. Last...
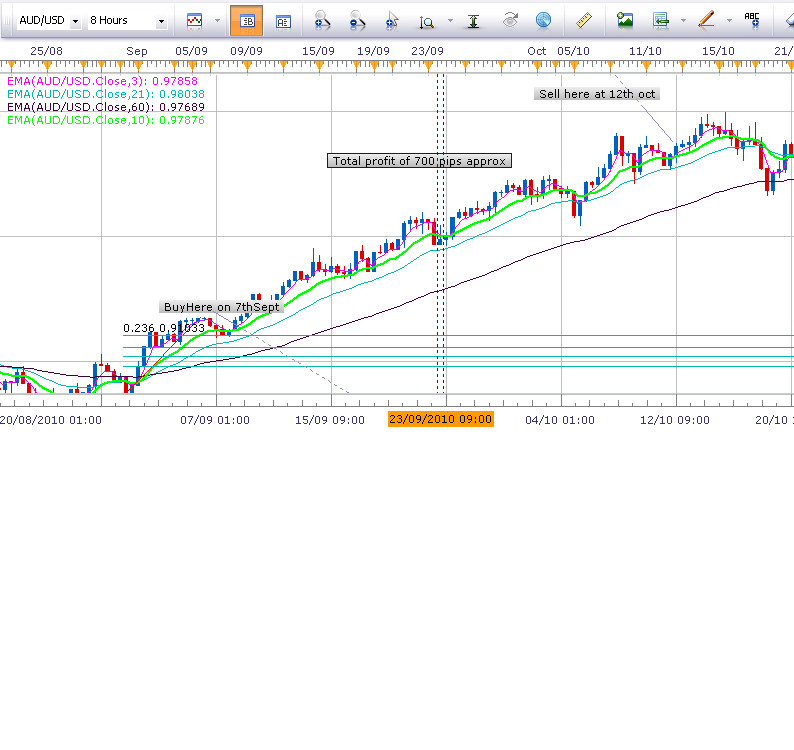


Based on COT decide on Buy when Net non Commercial goes up. When the up trend in non com stalls, then look to sell. Cut loss is 1ATR below 10EMAon 8 hr chart. Look to buy when the down trend changes in8hr chart
ReplyDelete